Kiran Limaye, Himank Kavathekar
-----------
On 8 November 2020, it will be four
years to an announcement of policy of withdrawal and reissuance of high
denomination currency notes, or what we popularly call ‘demonetization’. One of
the stated objectives of the policy was encouraging the use of non-cash payment
modes. It is generally considered that non-cash payment modes, debit and credit
cards, mobile based payment mechanisms like UPI and prepaid payment instruments
like mobile wallets are better than cash, for individual as well as for a
society. These non-cash alternatives have less risk of theft and both ends of
transactions are traced unlike cash which can be used without trace. But these non-cash
modes require higher consumer involvement (for example, knowing pins and
maintaining their secrecy and ability to operate smartphone beyond routine call
receipt and dial) which are not acquired by section of population, mainly due
to factors such as age or education. It was argued that during demonetization,
scarcity of cash has lowered (relatively) the cost of adoption of non-cash
payment modes and hence there will be greater permanent adoption of non-cash
payment modes. In this article, we try to see if demonetization has brought any
structural change in use of non-cash payment modes and if there is such change,
what seems to be the key driving factors of the change.
By non-cash payment modes, we will
be referring to point of sale (PoS) use of debit and credit cards, prepaid
payment instruments (PPI which includes mobile wallets and coupons such as
SODEXO) and UPI. [i]
We make use of time-series forecasting techniques to answer the question - is
post-demonetization usage of non-cash payment modes different than what it
could have been in the absence of demonetization. We generate an ARIMA forecast
for period of 36 months, from November 2016 to October 2019 and compare it with
observed values. Our objective is to provide an intuitive primary assessment of
change in use of non-cash payment modes. We understand the limitation of our
approach and accept that our conclusions will be indicative.
Reserve
Bank of India (RBI) provides monthly information on number of transactions and
value transacted by various payments modes. The reporting norms have been
changed since November 2019. Hence, we limit our analysis to period till
October 2019.[ii]
The comparison of forecast and observed is conducted for debit and credit card
usage and not for PPI and UPI. Pre-demonetization data of PPI and UPI is not
appropriate to generate a good forecast. Use of these payment modes picked up
the pace since late 2015 or early 2016 onwards and hence there is not much
systematic pattern in pre-demonetization information to generate a good
forecast.
 |
| Figure 1: Volume of non-cash payment mode transactions |
 |
| Figure 2: Value of non-cash payment modes transactions |
Figure 1 and Figure 2 show the evolution of non-cash payment mode usage. PPI and UPI are recent entrants compared to credit card and debit card. UPI has grown very rapidly, in both number of transactions as well as value transacted. PPI has small ticket size, reflects in greater share in volume but smaller in value. Credit card ticket size is large as it has smaller shares in volume, but grater share in value.
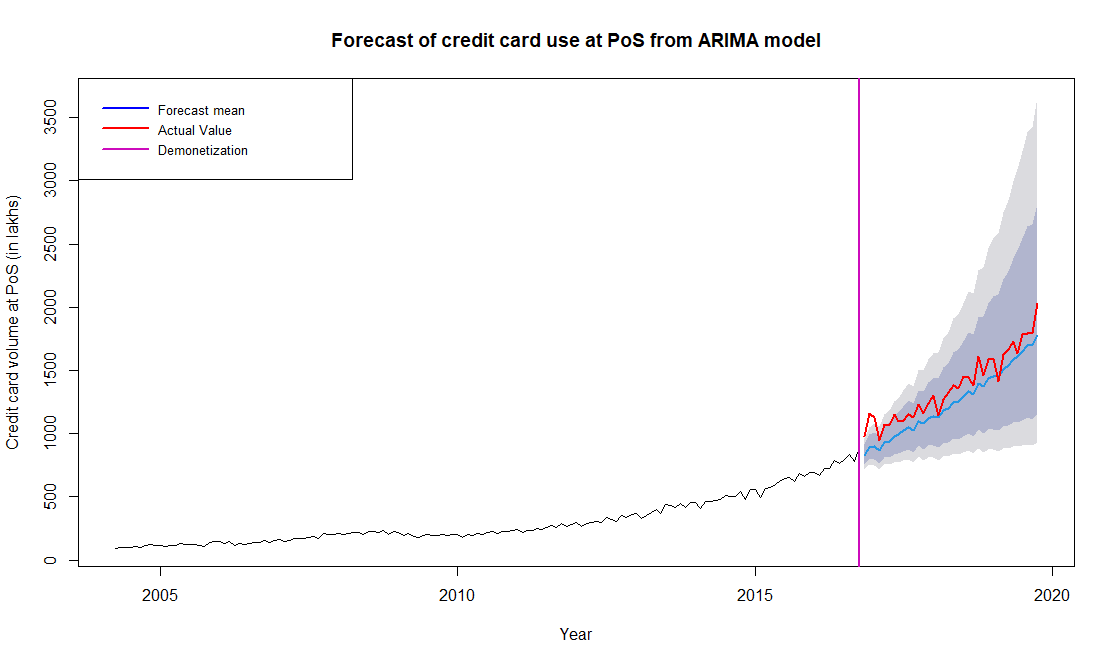 |
| Figure 3: Credit card PoS transactions volume |
 |
| Figure 4: Debit card PoS transactions volume |
 |
| Figure 5: Currency with public |
Figure 3,
Figure 4,
and Figure 5
hint that demonetization is likely to have led to a shift in the non-cash and
cash use in India. It is highly likely that debit card use would have been
considerably lower in the absence of demonetization (Figure 4).
But credit card use seems to have small up-tick, which is statistically not
different than counterfactual path. Credit card use is often pre-planned (for
EMI purposes or deferred payments) and selective and hence credit card is less
likely to become a substitute to cash in numerous daily transactions. Credit
cards are used by a growing but relatively smaller set of consumers compared to
debit card use. Hence, it is not surprising that credit card trajectory has
very minimal change while debit card use shows remarkable increase. PPI and UPI
use too has rapid rise in post-demonetization period (, but counterfactual
exerciser is not possible for these two non-cash modes (Figure 6
and Figure 7).
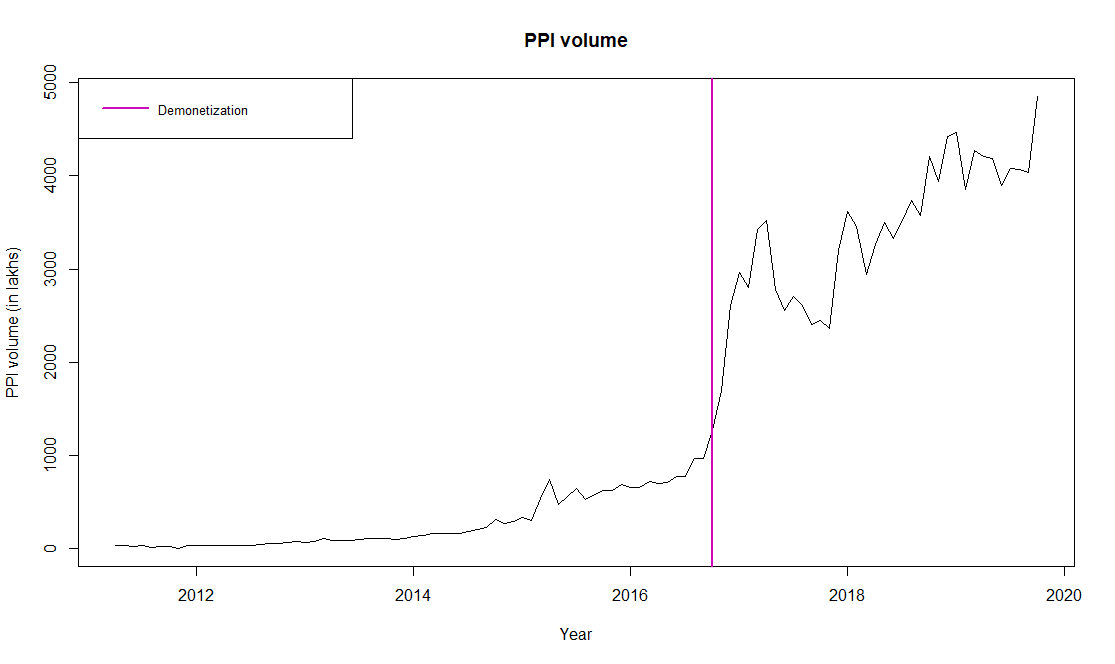 |
Figure 6: PPI transactions volume |
 |
| Figure 7: UPI transactions volume |
In post-demonetization period, it became increasingly easy to use the debit cards. Figure 8 shows
 |
| Figure 8: Point of Sales |
that availability of Point of Sales (PoS),
physical and digital avenues to use non-cash payment modes, increased rapidly
in few months following demonetization. The growth slowed down but sustained in
later months as well. Rapid growth in PoS was driven by incentives faced by
sellers. Extreme scarcity of cash made the non-cash payment modes more
attractive and regulators waived off the merchant charges of small ticket
transactions for certain duration.
Increased use of non-cash payment modes is likely to have
taken out some demand for cash and it is perhaps reflected in level of currency
in the economy. (Figure
5).
The role of counterfactual is particularly important here. Often post and
pre-demonetization levels are compared and naïve comments like ‘cash is more
than pre-demonetization levels’ are made. Demonetization was not permanent
removal of cash; it was substitution of currency notes and hence the scarcity
existed only for the period of two months. Cash grew rapidly in
post-demonetization period, but still these levels are likely to be lower than
what would have been in the absence of demonetization.
 |
| Figure 9: Debit card transactions volume |
 |
| Figure 10: Average amount withdrawn in debit card use at ATM |
There is limited evidence of widespread adoption of
non-cash payment modes. Average ₹ withdrawn from ATM per transaction has not
fallen (Figure
10).
But volume of ATM transaction is likely to be lower than what it could have
been (Figure
9).
A simple explanation of this is of consumer dichotomy based on their ability to
handle the digital interfaces. Section of Indian consumers, which already was
eager and equipped to use non-cash payment modes have substituted their much of
their cash use with non-cash payment modes. These consumers were predisposed
towards non-cash, but sellers accepting non-cash payments in pre-demonetization
period were few. Demonetization increased the acceptance of sellers towards
non-cash payment modes, which facilitated the non-cash payment modes use of digital
savvy consumers. But remaining consumers have continued their cash preference,
reflected in ATM use patterns.
Use of
non-cash payment modes witnessed a remarkable one-time positive shock due to
demonetization and some of the shock seem to have sustained in higher use of
non-cash payment modes and somewhat lower currency levels. But the cash-scarcity
was perhaps too short-lived to bring large fraction of cash preferring
consumers to non-cash mode camp.
[i]
These are modes used by many consumers to pay for their purchases. NEFT
and IMPS are not considered because they are less likely to be used by
consumers, though there might be set of transactions, like coaching class fees,
where consumers might be paying by NEFT. The omission is not very problematic,
as likelihood of no using cash for these transactions is likely to be same in
pre and post demonetization periods. But for numerous small-ticket size
transactions, like buying biscuits from shops, one is far more likely to pay by
non-cash payment modes in post-demonetization period than during
pre-demonetization period.
[ii] As it turns out, it is not a
big cost. From March 2020 onwards, economy went into a comatose mode due to lockdown.
So any pre and post comparison would have been cut short at February 2020.